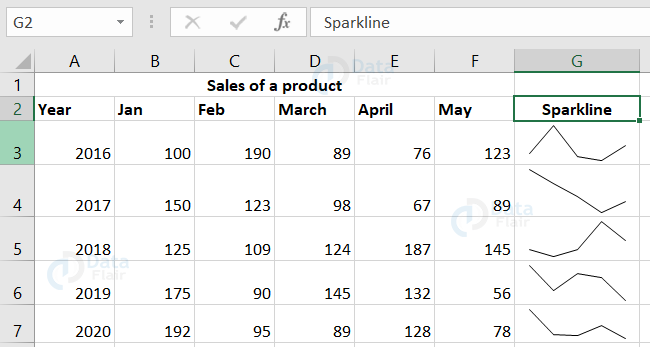
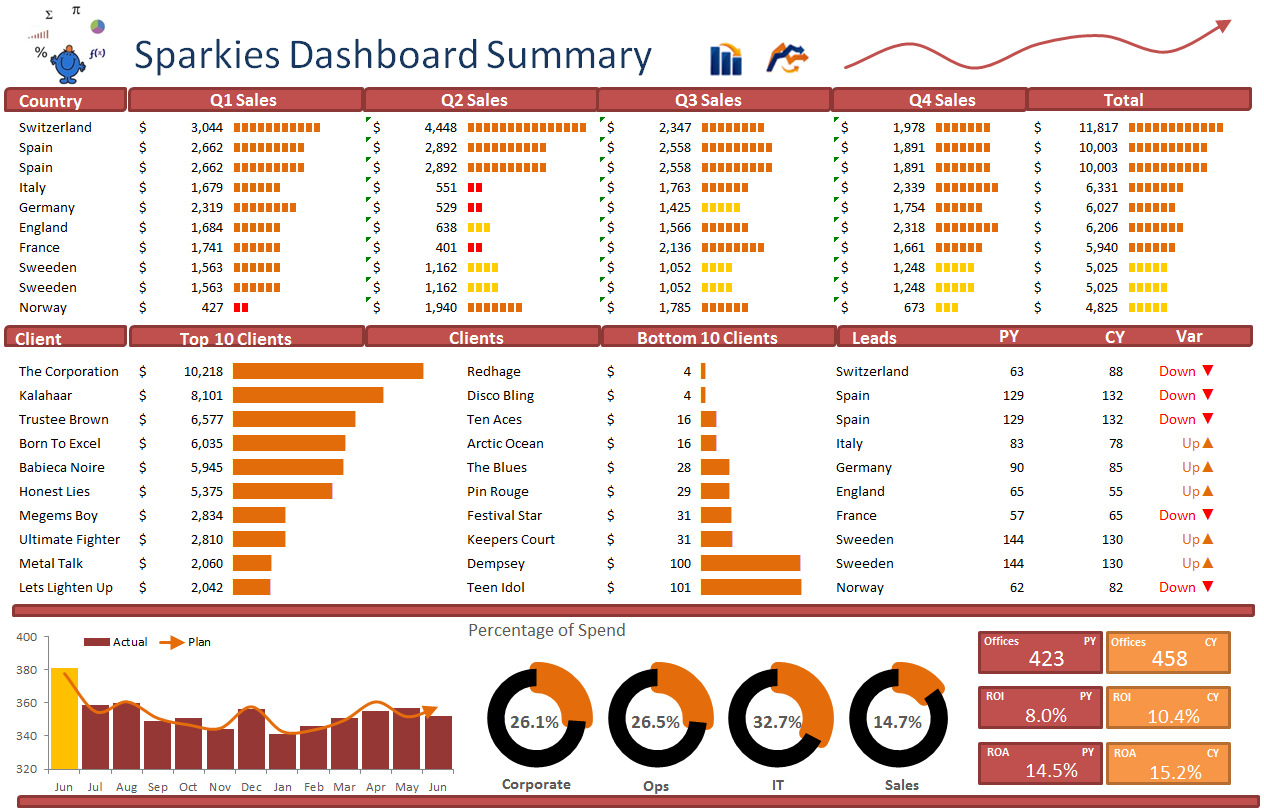
Excel Sparklines are tiny, lightweight charts embedded in a cell, providing a visual summary of data trends like sales or revenue over time. They are ideal for dashboards, enabling users to interpret information quickly. Sparklines enhance your data presentations without clutter, allowing for better visual storytelling in Excel spreadsheets.